Status Page Aggregators
Status page aggregators consolidate outages from thousands of Cloud, SaaS, and other third-party services into one unified dashboard. Know instantly when your dependencies go down.
What is a Status Page Aggregator?
A status page aggregator is a monitoring tool that automatically collects and displays the operational status of multiple third-party services in a single, unified dashboard. Instead of manually checking dozens of status pages, an aggregator polls official status pages from cloud providers, SaaS platforms, and other services you depend on - and alerts your team instantly when something goes wrong. It can also give you a unified view of the statuses of your dependencies - so you can see if your services are affected by an outage on another service.
A status page aggregator is like a central nervous system for your tech stack. When AWS has an outage, when Stripe payments are degraded, when GitHub is unavailable, or when any of the 100+ services you rely on experiences issues, you know about it immediately through your preferred notification channel - whether that's Slack, email, Microsoft Teams, or a custom dashboard built using a webhook. Or you can also display a unified status page of all your dependencies on a large TV screen in your NOC or office.
Status page aggregators are used by Ops teams, SREs, IT Teams, System administrators, customer support teams, product managers, and MSPs who can't afford to waste time discovering critical outages through customer complaints or manual status page checking.
Why Modern Teams Need Status Page Aggregation
The Complexity of Modern Tech Stacks
The average company today uses 110+ SaaS tools to run their business. From cloud infrastructure (AWS, Azure, Google Cloud) to payment processors (Stripe, Square), communication platforms (Slack, Zoom), productivity tools (Notion, Asana), developer tools (GitHub, GitLab, Jira), and specialized services for every imaginable business function - the managed third-party tech stack has exploded.
Each of these services has its own status page. Each one can have outages and thus can impact your business. Yet most teams have no centralized way to track them all.
The Cost of Downtime
When your critical dependencies go down:
- • E-commerce companies lose thousands per minute in revenue
- • SaaS platforms face customer churn and reputation damage
- • Your engineering team is unable to push hot fixes to production
- • Your IT operations team is unable to coordinate incident response across teams
- • Your support team gets flooded with "Is it us or them?" tickets
- • You appear unprepared and reactive rather than proactive
Manual Monitoring is Impossible
Checking 110+ status pages manually isn't feasible. Your team would need to constantly refresh browsers, set up custom RSS feeds and email subscriptions, and correlate alerts from dozens of different sources. Critical updates get missed and noise will overcome real signals. By the time you discover an outage affecting your customers, the damage is done.
How Status Page Aggregators Work
Real-Time Monitoring
The aggregator continuously polls official status pages from thousands of services including AWS, Azure, Google Cloud, Stripe, GitHub, Slack, Twilio, and more. Polling happens periodically, ensuring you catch incidents within minutes of when they start. The official status page data is augmented with community reports and independent testing.
Behind the scenes, the system automatically normalizes different status page formats - some use Atlassian's standard API, others have custom JSON endpoints, some are pure HTML, some are RSS feeds, and others are webhook based - and extracts the critical information: service name, components affected, incident summary, and severity level.
Unified Status Page
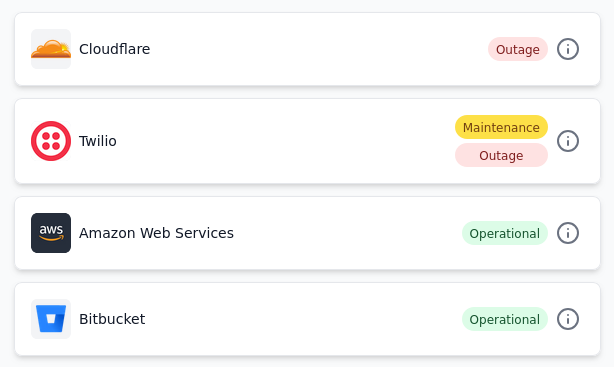
As a status page aggregator user you can choose which services you wish to monitor. Your monitored services appear in one place with component-level visibility. See at a glance which services are operational, which are degraded, and which are down. Color-coded indicators make it instantly clear which services have outages and maintenance events going on.
Every incident is logged with full historical data - when it started, how long it lasted, which components were affected, detailed intermediate status updates, and a post-mortem analysis (if available) from the vendor. This historical tracking helps you identify unreliable vendors and justify contract negotiations or platform migrations.
Sophisticated Alerting
When an incident is detected, notifications can go to your team through multiple channels: Slack, Email, Microsoft Teams, PagerDuty, Discord, or custom webhooks. Smart filtering ensures you only get alerted about services that matter to you, reducing alert fatigue. Notifications can also be sent to your support teams via ticketing systems like Freshdesk, BoldDesk, Zendesk etc.
You can configure alerting rules by lifecycle, type, and component. You might want all notifications for certain high-criticality services but only start/end updates for low-criticality ones. Some service maintenance notifications may not be useful for you - you can turn them off and receive only outage alerts.
Status Page Aggregators vs. Other Approaches
Why purpose-built aggregators win over other approaches for third-party vendor monitoring.
Manual Status Page Checking
Building Custom Solutions
RSS Feeds & Email Subscriptions
Crowdsourced Information Sites
Social Media
Status Page Aggregator ✓
Who Uses Status Page Aggregators?
Status page aggregators are used by different teams and organizations to monitor their third-party dependencies and services.
Ops & SRE Teams
Correlate third-party outages with internal incidents. When your internal monitoring alerts fire, know instantly if it's your code or if AWS, Stripe, or another dependency has an issue. Reduce MTTR by eliminating the "is it us or them?" investigation phase.
Engineering Leaders
Make informed decisions about vendor reliability. Track uptime history before renewing contracts or migrating to new platforms. Use incident data to negotiate better SLAs and justify architectural decisions.
Customer Support Teams
Answer "Is it us or them?" in seconds. Proactively notify customers about third-party issues affecting their experience. Reduce support tickets by communicating outages before customers complain.
IT Operations
Monitor all SaaS tools your organization depends on. Keep employees informed when Slack, Zoom, Office 365, or other critical tools have issues. Coordinate incident response across departments.
Product Teams
Understand how third-party reliability impacts your product roadmap. Plan features around known vendor maintenance windows.
Agencies
Monitor services that your delivery teams and partners rely on.
Managed Service Providers
Monitor services across multiple clients with white-label dashboards. Build custom dashboards for each client. Demonstrate proactive monitoring and build trust with detailed incident reports.
E-Commerce Platforms
Critical for payment gateway and shipping provider monitoring. Know instantly when Stripe, PayPal, or other payment providers have issues.
Security & Compliance Teams
Vendor risk management requires understanding reliability history. Track compliance-critical services for audit purposes. Document third-party incident patterns for vendor review processes.
Essential Features of Status Page Aggregators
Most premium aggregators have a minimum feature set for third-party status page monitoring.
Service Coverage
The breadth of services matters, but so does depth. A good aggregator monitors all major services in each domain, as well as adds new ones on demand:
- Infrastructure: AWS, Azure, Google Cloud, DigitalOcean
- Payments: Stripe, PayPal, Square, Braintree
- Communication: Slack, Zoom, Microsoft Teams
- Developer Tools: GitHub, GitLab, Jira, CloudFlare
- Observability: Datadog, New Relic, etc.
- Monitoring: Prometheus, Grafana, etc.
- Logging: ELK, Splunk, etc.
- Security: Okta, Auth0, etc.
- CDN/DNS: Cloudflare, Fastly, etc.
Real-Time Detection
Good aggregators should be able to notify you as soon as an issue is detected:
- Detection from official status page data as soon as the pages are updated..
- Early warning based on community reports crossing thresholds.
- Synthetic monitoring of APIs and other endpoints where available to detect issues before the status pages are updated.
Fine-tuned Alerts
Good status page aggregators should allow you to fine-tune which alerts you receive to prevent alert fatigue:
- Alerts filtered by specific components that reflect the services you actually use.
- Lifecycle based-filtering - start/end alerts for non-critical services, and all updates for critical services.
- Severity based-filtering - only alert on major outages, not degraded performance.
- Filter by type of incident - outage, maintenance
- Turn off alerts completely for specific services
- Upcoming maintenance window reminders
Early Warnings
Premium aggregators can sometimes detect incidents before official status pages are updated:
- Community reports from users who are seeing issues
- Own monitoring of specific API endpoints
- Integration with third-party incident monitoring systems
- Aggregated data from social media websites
- All this augments the official status page data
Historical Analytics
Complete incident history enables:
- Vendor reliability scoring and comparisons
- SLA compliance verification and disputes
- Incident pattern identification (time of day, frequency)
- Compliance and audit documentation
- Contract negotiation leverage with vendors
- Business continuity planning and risk assessment
Integration Ecosystem
Alerts must reach your team where they work:
- Chat: Slack, Microsoft Teams, Discord
- Incident Management: PagerDuty, Incident.io
- Communication: Email, SMS, Webhooks
- Ticketing: Freshdesk, BoldDesk, Zendesk
- Automation: IFTTT, Zapier, Webhooks
- Custom Integrations: Webhooks, API integrations
Unified Status Page
A premium aggregator should have a way to view the overall status of all your services on a single page:
- A single page that shows the health status of all your services
- White-labeled with your own branding and domain
- Can be displayed on a large TV screen in your NOC or office
- Upcoming maintenance windows so your team can plan around them
- Private status page - SSO/password protection so only your team can access it
- Mobile-device friendly
Multiple Teams and Users
A good aggregator should support multiple teams and users within the same organization account:
- Role-based access control
- User management
- Team management
- Organization management
- Multiple users per team
- Independent services, alerts, historical data per team
Service Coverage
Modern organizations depend on multiple cloud and SaaS providers and need unified visibility across their entire infrastructure stack.
Multi-cloud Status Monitoring
Amazon Web Services (AWS): Monitor all 39 AWS regions and 200+ services including EC2, S3, RDS, Lambda, CloudFront, Route 53, DynamoDB, and every other AWS service your applications depend on. Get component-level alerts so you only hear about services you actually use.
Microsoft Azure: Track Azure's worldwide status across all services and regions. Monitor Virtual Machines, Azure SQL Database, App Service, Storage, Azure Functions, and other critical dependencies with granular component filtering to reduce noise.
Google Cloud Platform: Stay informed about GCP service health including Compute Engine, Cloud Storage, BigQuery, Cloud Functions, Kubernetes Engine, and all other GCP services across every global region.
Multi-Cloud Unified View: For organizations using hybrid or multi-cloud architectures, a status page aggregator provides a single dashboard showing the health of AWS, Azure, GCP, DigitalOcean, Linode, Vultr, and other infrastructure providers simultaneously. No more checking 5+ different vendor dashboards during incidents - see everything in one place with normalized status indicators.
Regional Filtering: Configure alerts by specific cloud regions to match your deployment footprint. If you only use us-east-1, eu-west-1, and ap-southeast-1, you'll only get alerts for issues in those regions, not every cloud region globally.
How Status Page Aggregation Technology Works
A high-level view of the key building blocks of status page aggregation technology.
1Data Aggregation and Extraction
Status page aggregators use multiple techniques to extract status from third-party vendor status pages:
- JSON APIs: Atlassian Statuspage, Status.io etc use standard, well documented APIs.
- RSS Feeds: Industry standard format for periodic changes over time. These differ across status pages.
- HTML Parsing: For custom status pages without APIs or RSS feeds.
- Webhook Listeners: Real-time updates pushed from vendors that support them.
- Private Status Pages: Private status pages are monitored using customer-supplied credentials.
2Data Normalization
Different vendors report status differently. Aggregators normalize to a common format:
- Status categories: Operational, Degraded, Partial Outage, Major Outage, Minor Outage.
- Component mapping: Identify which specific services are affected.
- Timestamp normalization: Handle different timezone reporting.
- Severity mapping: Automatically determine incident impact.
- Type mapping: Automatically determine incident type - outage, maintenance, future maintenance.
2Community Signals
Community signals are used to augment the official vendor status page data:
- Community reports from users who are experiencing issues.
- Social media monitoring for user reports as well from official social media handles.
- Forum reports from users who are seeing issues.
2Endpoint Monitoring
The aggregator's own synthetic monitoring of APIs/endpoints where available augments the official status page data:
- API endpoints (where available) are monitored for availability and response time.
- Response are compared against baseline thresholds to determine if an issue is likely.
- Data are combined with other signals and status page data to determine the overall health of the service.
2Data Storage
The normalized data is stored for later retrieval and analysis:
- Complete incident data for each vendor, service, component with start/end time, duration, severity, type, component.
- Community signals and endpoint monitoring data are stored separately and fed into the incident detection engine.
- Incident data can run into millions of records over time - implying efficient storage and retrieval are crucial.
3Alert Routing
Alerts are filtered using user-specific rules:
- A routing engine determines which users and teams should be notified for each incident.
- The routing engine uses a chain of filters - incident lifecycle, severity, type, component, etc.
- Routing can be at the team level or user level, depending on the configuration.
3Reliable Notification Delivery
Notifications are delivered to configured channels:
- Slack, Email, Microsoft Teams, PagerDuty, Discord, or custom webhooks are commonly used channels.
- Notifications can also be sent to your support teams via ticketing systems like Freshdesk, BoldDesk, Zendesk etc.
- The alert payload varies based on the channel and the configuration.
- If the channel has issues the delivery is retried with exponential backoff.
4Analytics and History
Aggregators maintain historical data for each service:
- Per vendor, per service, per component.
- Background processes analyze the data to generate insights and reports.
- Reports can be generated for various purposes - uptime, incident trends, compliance, etc.
4Data Source Change Detector
A status page aggregator continuously checks for changes in the third-party vendor status pages it monitors:
- URLs, formats, APIs can change.
- Components are added/removed/renamed.
- M&A events can change the status page URL/components.
- Vendors can change status page providers from managed to custom and vice-versa.
Reliability Considerations
Distributed polling across multiple geographic regions ensures aggregators can detect outages even if one or more polling instances fail.
Multiple checks verify incidents before alerting - prevents false positives from temporary glitches.
Alert delivery is retried with exponential backoff if channels have issues.
How to Choose the Right Status Page Aggregator
Evaluation Criteria
Does it monitor all services critical to your business? This is more important that the total number of services it monitors.
Does it support your preferred channels? Does it support chat/email/collaboration/paging/ticketing systems?
Does it have support for component filtering, alert lifecycle filtering, alert type suppression, maintenance reminders?
Is the pricing model per-user, per-service, or flat-rate? Make sure pricing scales with your needs and doesn't penalize growth.
SSO, RBAC, audit logs - ensure the tool scales to your organization's compliance and team requirements.
Is there a unified status page that shows the health status of all my services on a single page? Can I white-label it with my own branding and domain?
Can it detect incidents before official status pages update?.
Custom integrations need API access - ensure it's available at your price tier.
Can you ingest data from private status pages?
Questions to Ask Aggregator Vendors
Real-World Status Page Aggregator Use Cases
E-Commerce Platform Preventing Revenue Loss
An online retailer uses a status aggregator to monitor payment gateways (Stripe, PayPal) . When Stripe had a 15-minute outage, the aggregator alerted them instantly. Their support team immediately switched to backup payment processing and prevented an estimated $50K in lost sales.
MSP Managing 50+ Client Accounts
A managed service provider uses a white-labeled aggregator to monitor AWS, Azure, and other services for each of their 50 clients. Each client has a different set of services they need to monitor, and an aggregator allows the MSP to create white-labeled status pages for each client. This positions them as proactive, allows them to get ahead of issues, and enables them to provide detailed incident reports for customer communication.
Ops Team Reducing MTTR by 40%
A SaaS company noticed their mean time to resolution for customer-reported issues was 45 minutes. Often, the issue wasn't their code but a third-party service. With a status aggregator, they eliminated the "is it us or them?" investigation phase and reduced MTTR to 15-20 minutes.
Support Team Reducing Ticket Volume by 35%
When a third-party service experienced an outage, a customer support team received hundreds of tickets asking if the issue was on their end. With an aggregator updating their status page about the health status of the services they use, 35% of incoming tickets during outages were prevented entirely.